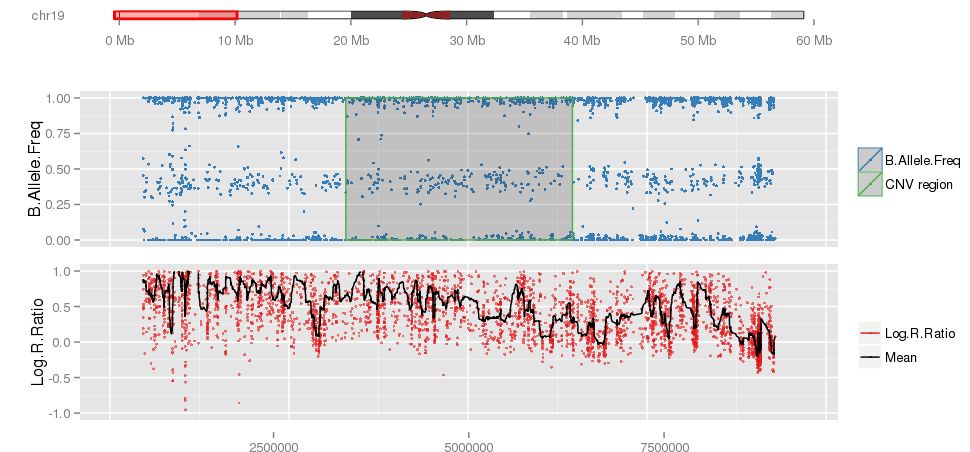
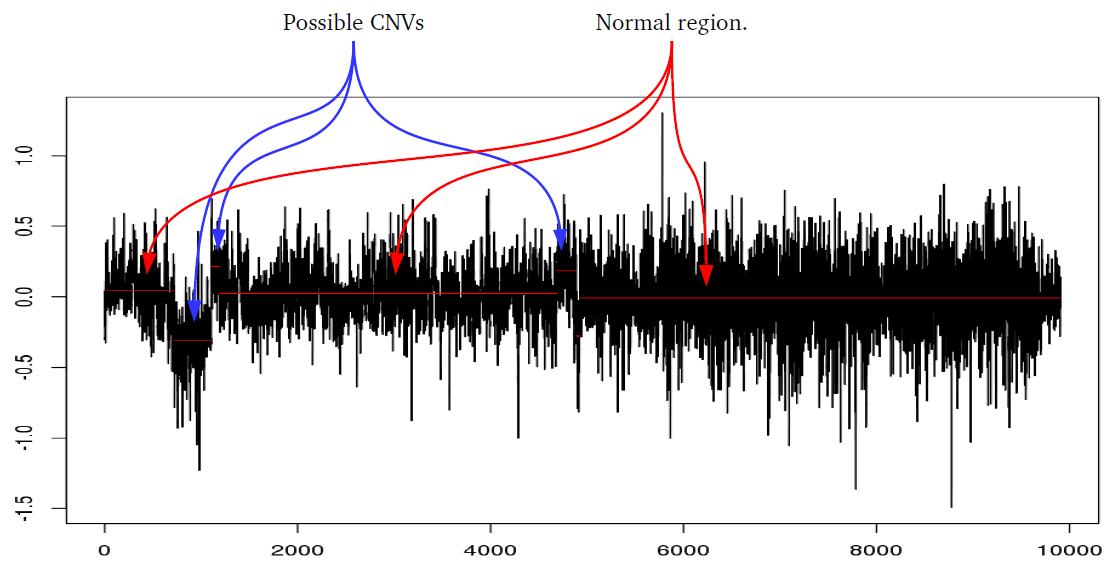
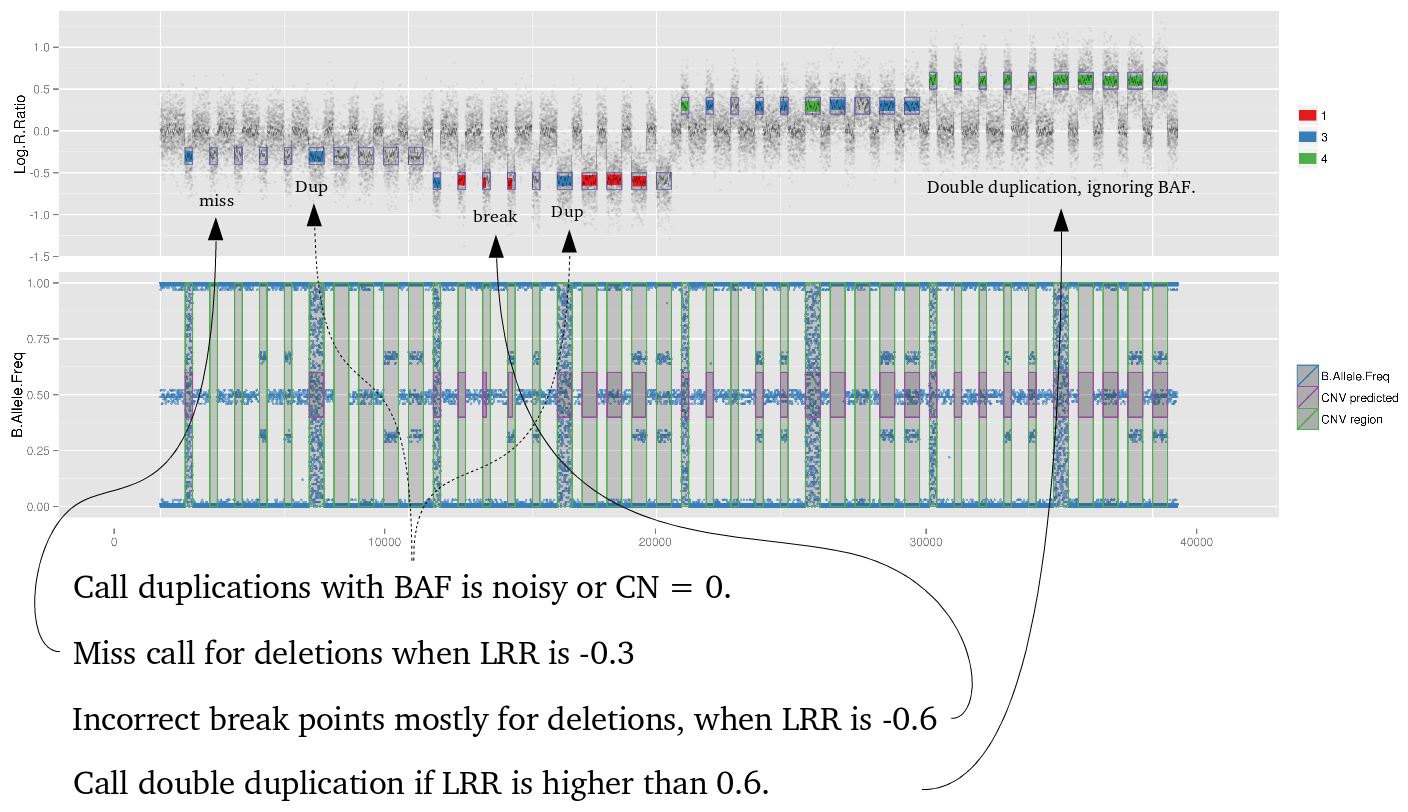
Amplified DNA from dried blood spots offers number of challenges for copy number of variation detection. Here we describe some of the challenges one can find working with DBS data.
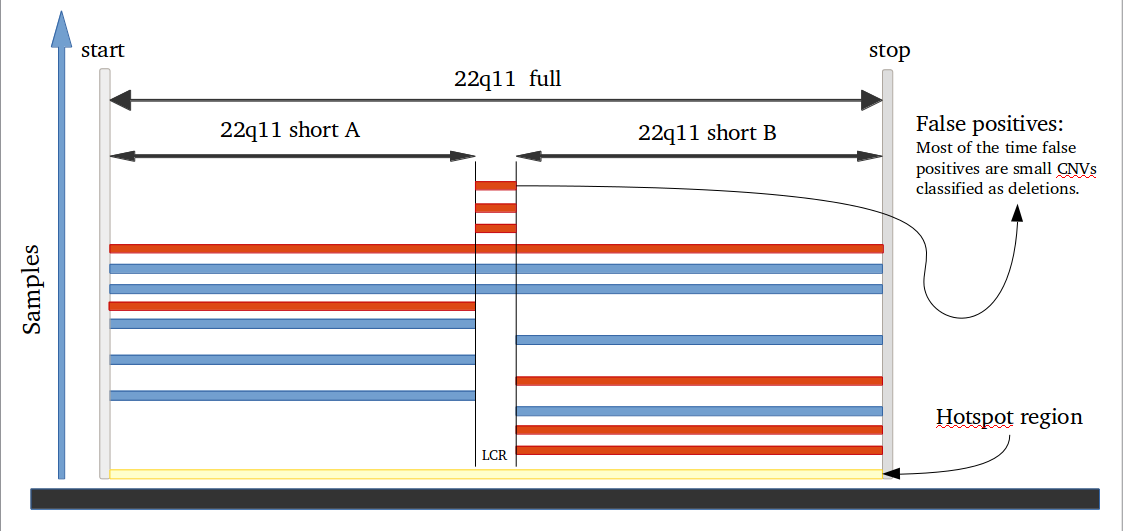
To measure sensitivity and specificity on CNV prediction we created a function that evaluate CNVs results as binary classification. This work mostly when all CNV regions are known in the genome and large number of CNVs are present. Therefore, we developed a function to generate hundreds of CNVs in one sample in specific regions, simulating Psych chip SNP array. Genome regions are classified as 0 for normal and 1 for CNV region. If a CNV of any size is predicted in region 0, it is considered a false positive. On CNV regions, true positive predictions are defined only if the sum of the length of all CNVs predicted in the region is higher than 80% and smaller than 120%.
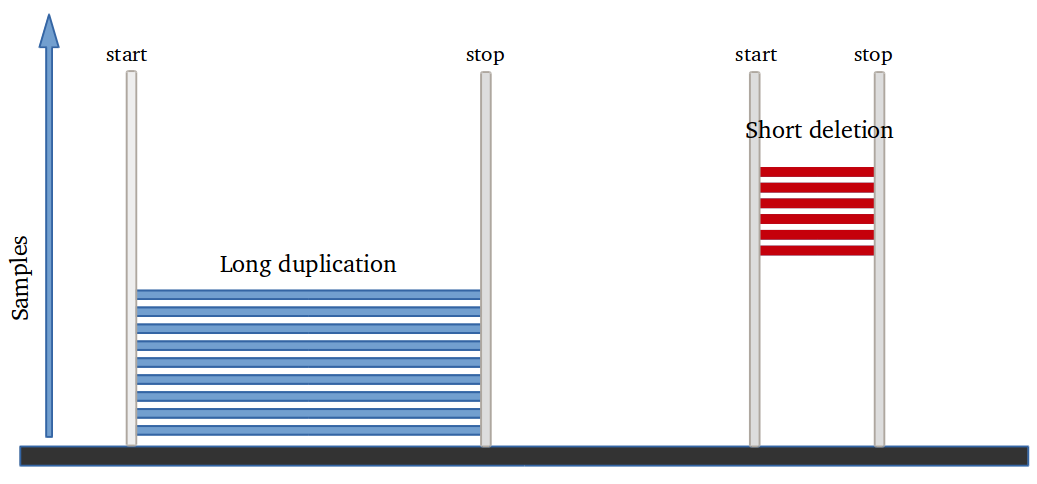
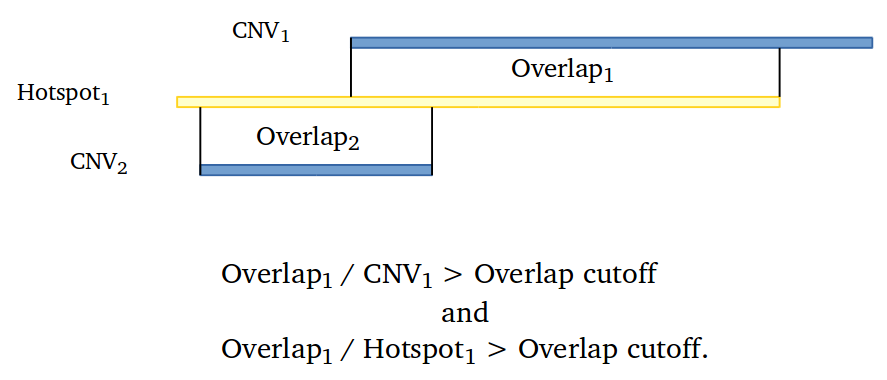
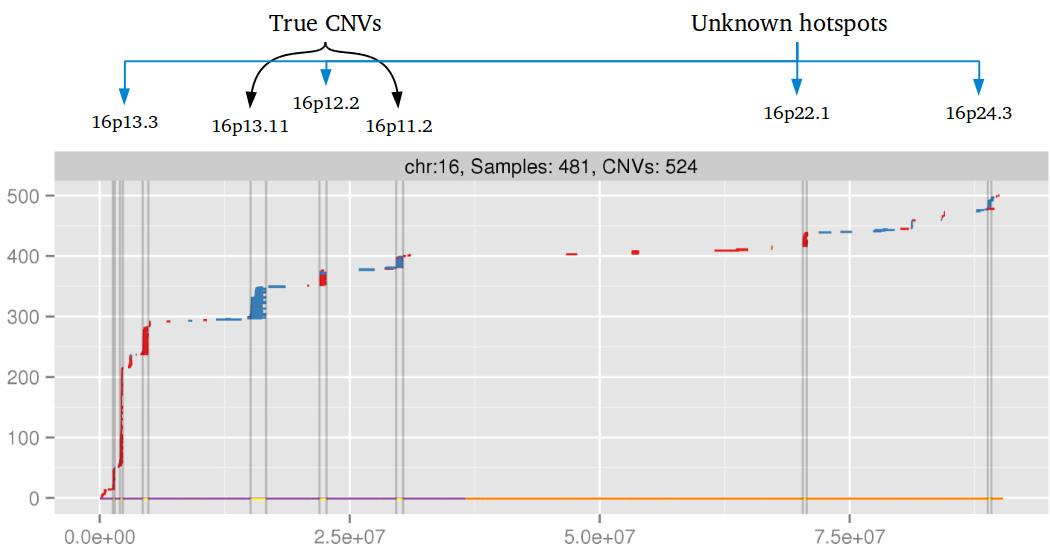
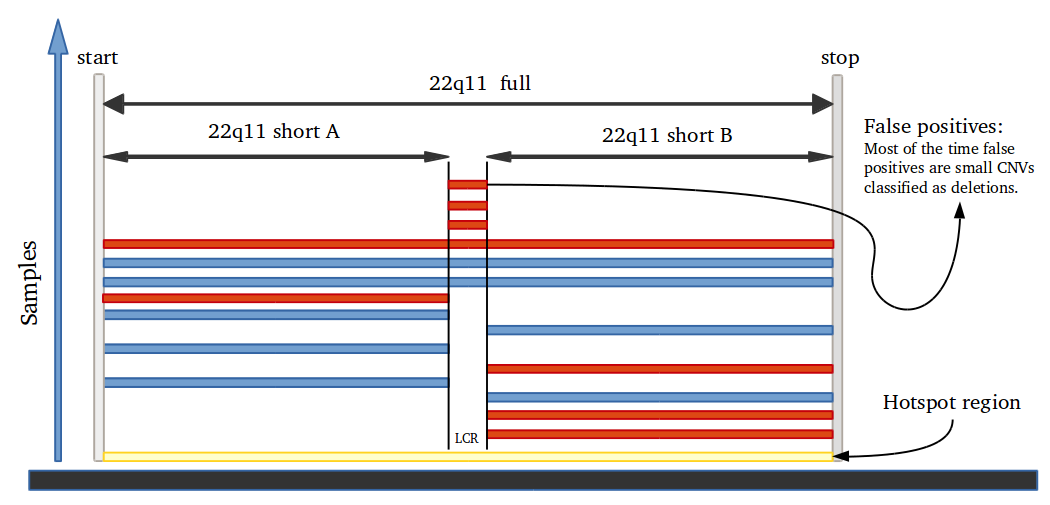
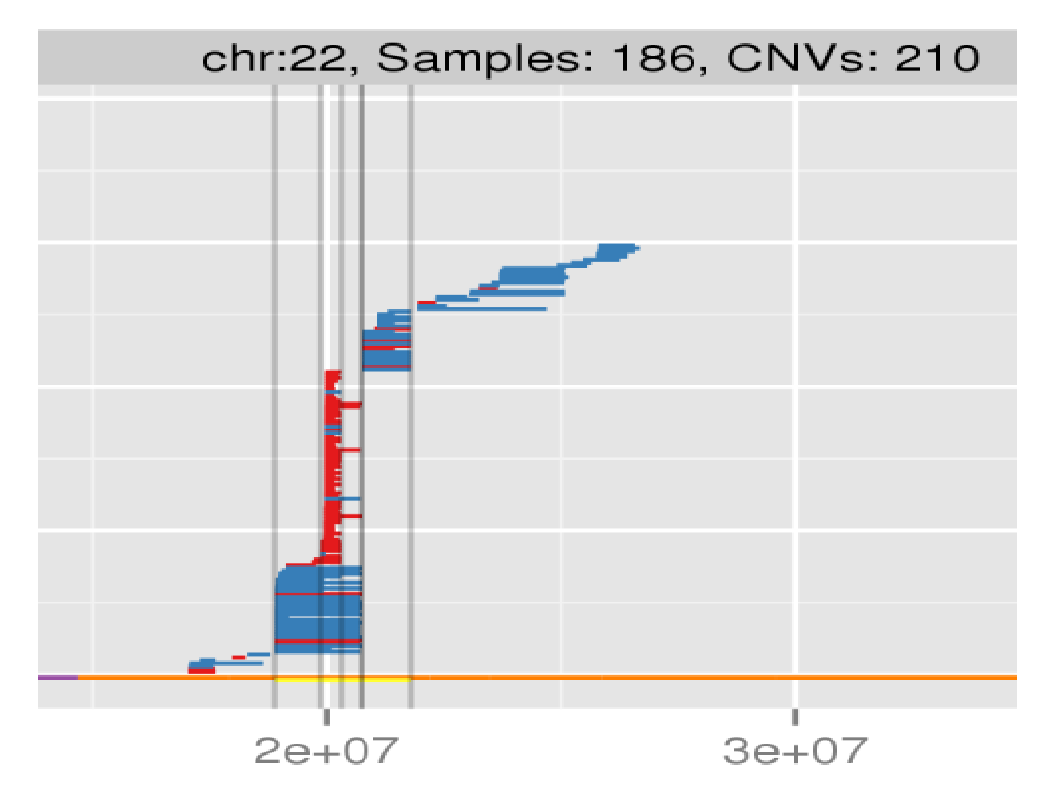
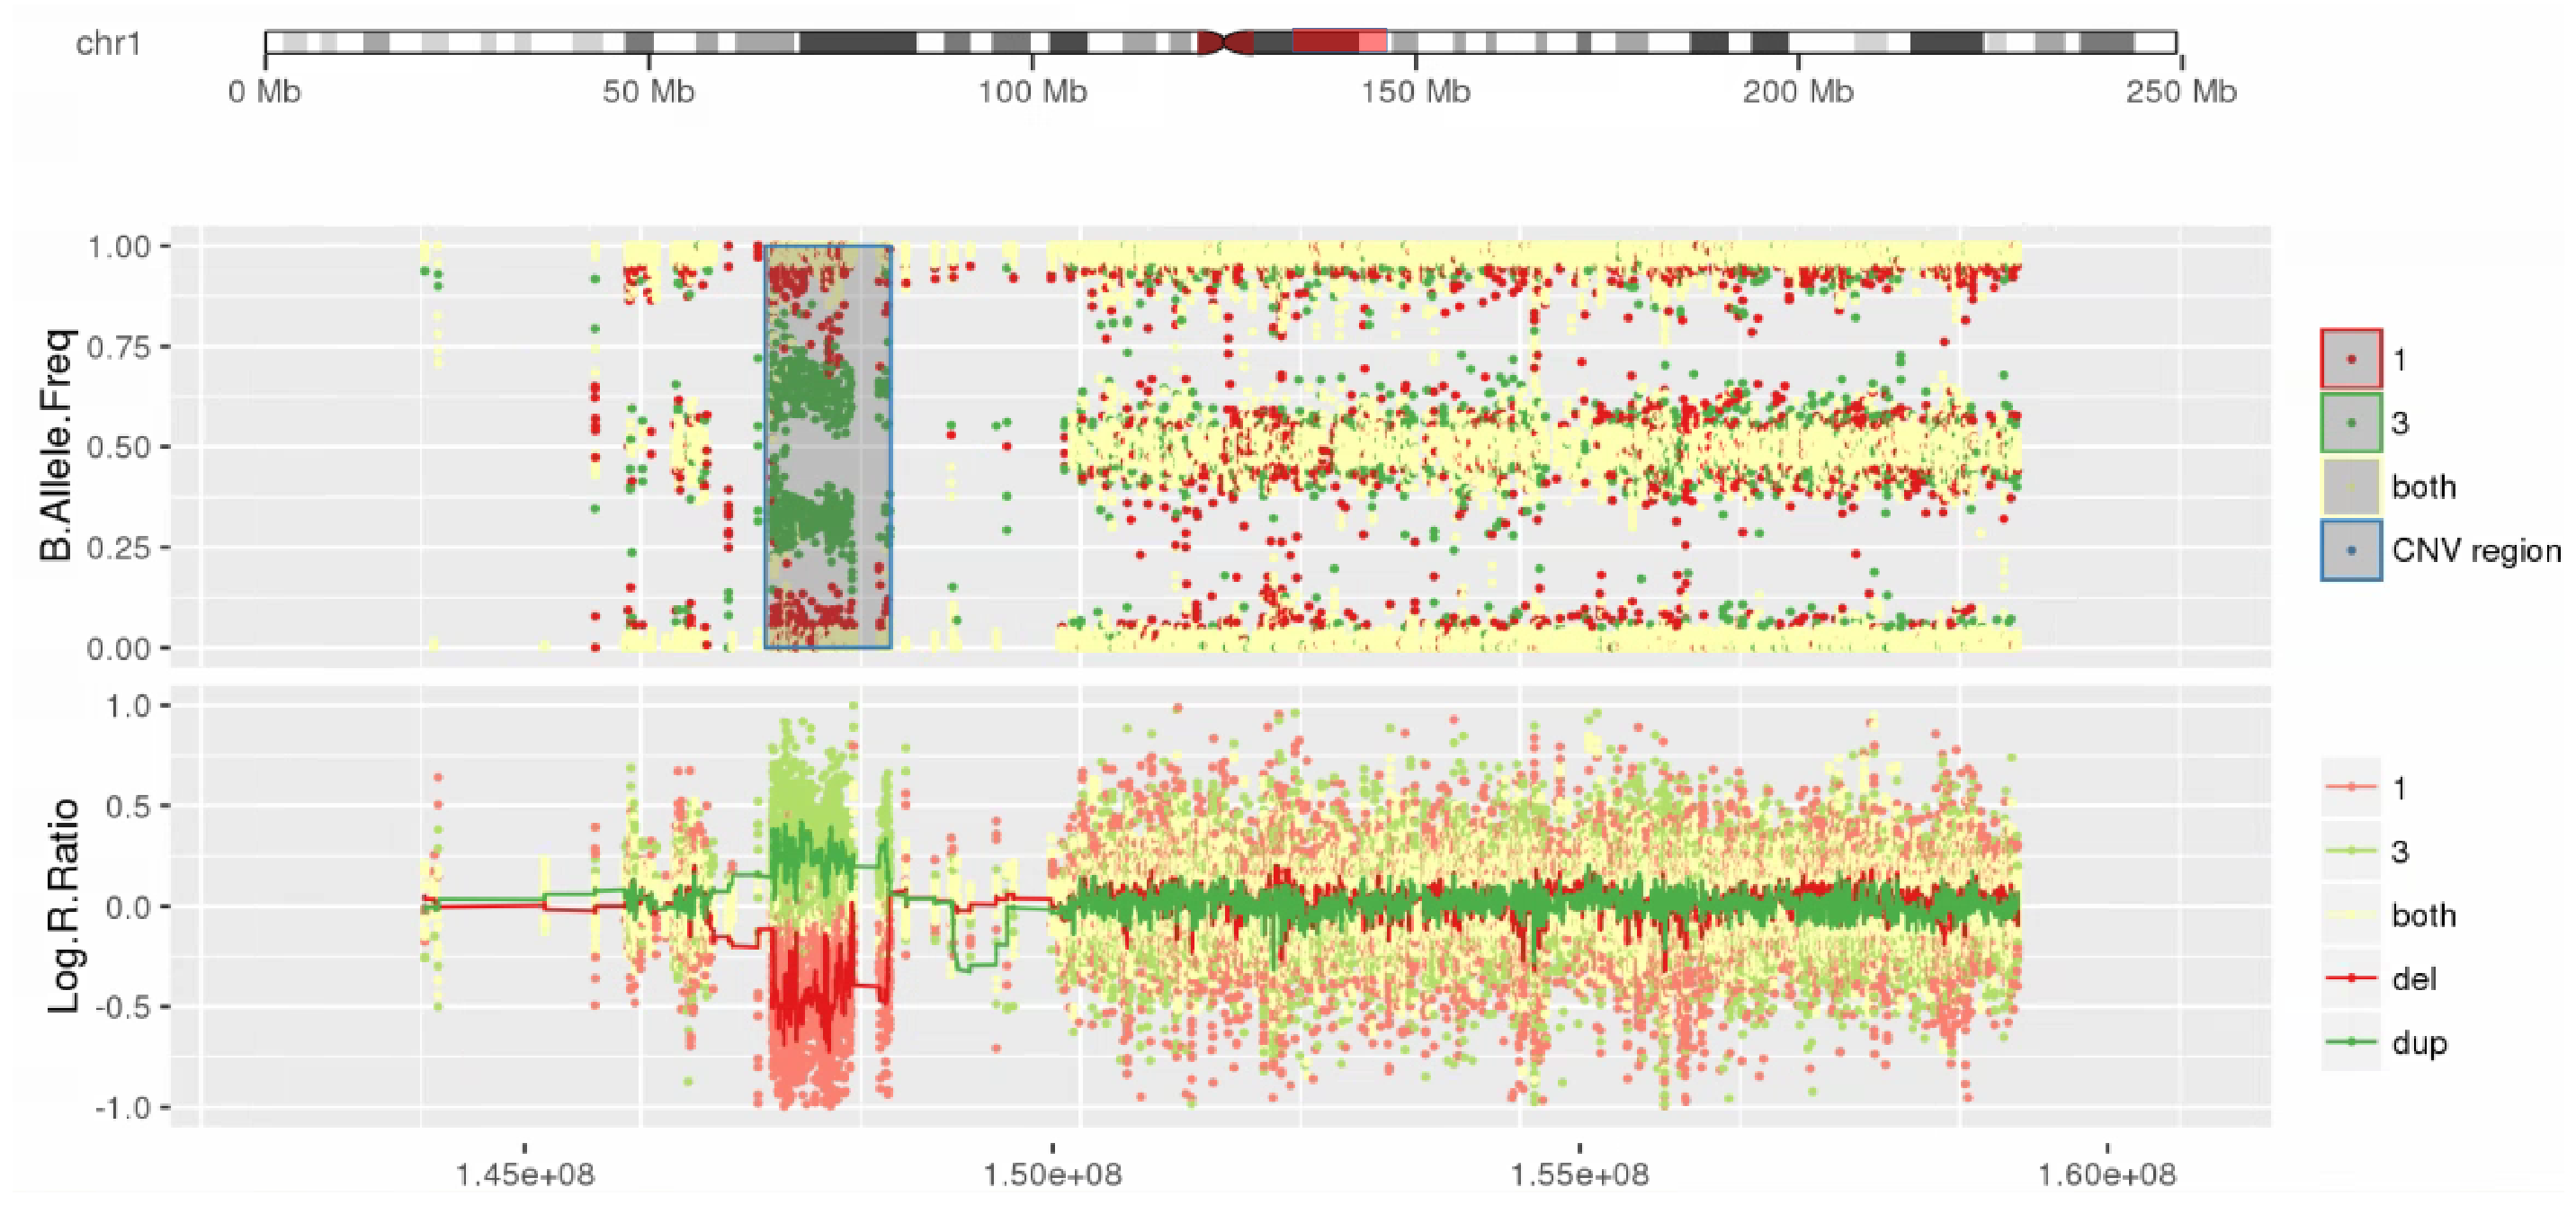
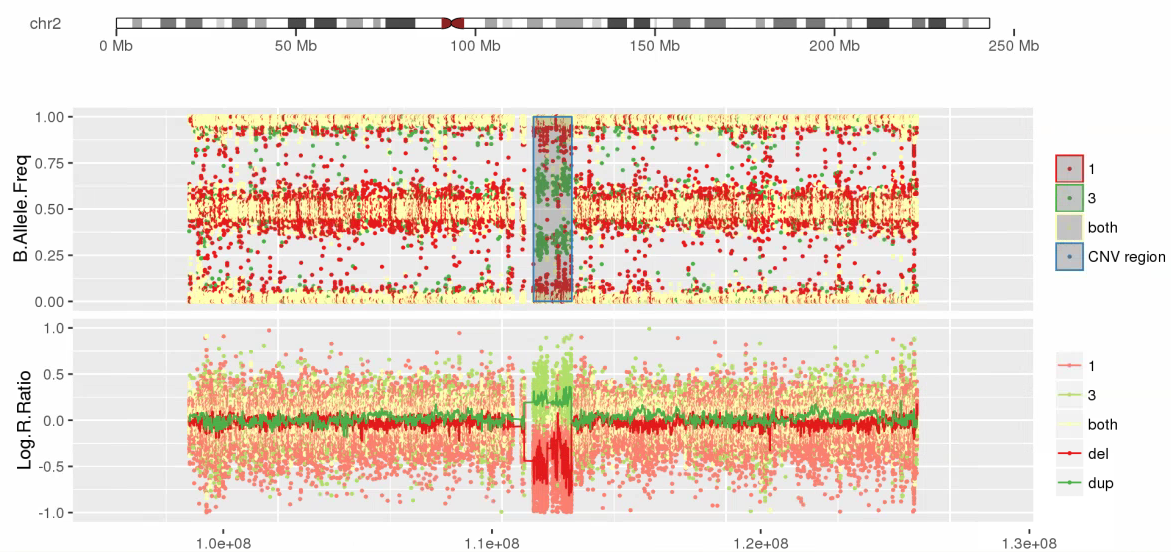

Amplified DNA from dried blood spots offers number of challenges for copy number of variation detection. Here we describe some of the challenges one can find working with DBS data.
iPsychCNV package offers a series of tools that can be used in the CNV prediction pipeline, but also independent with other programs.

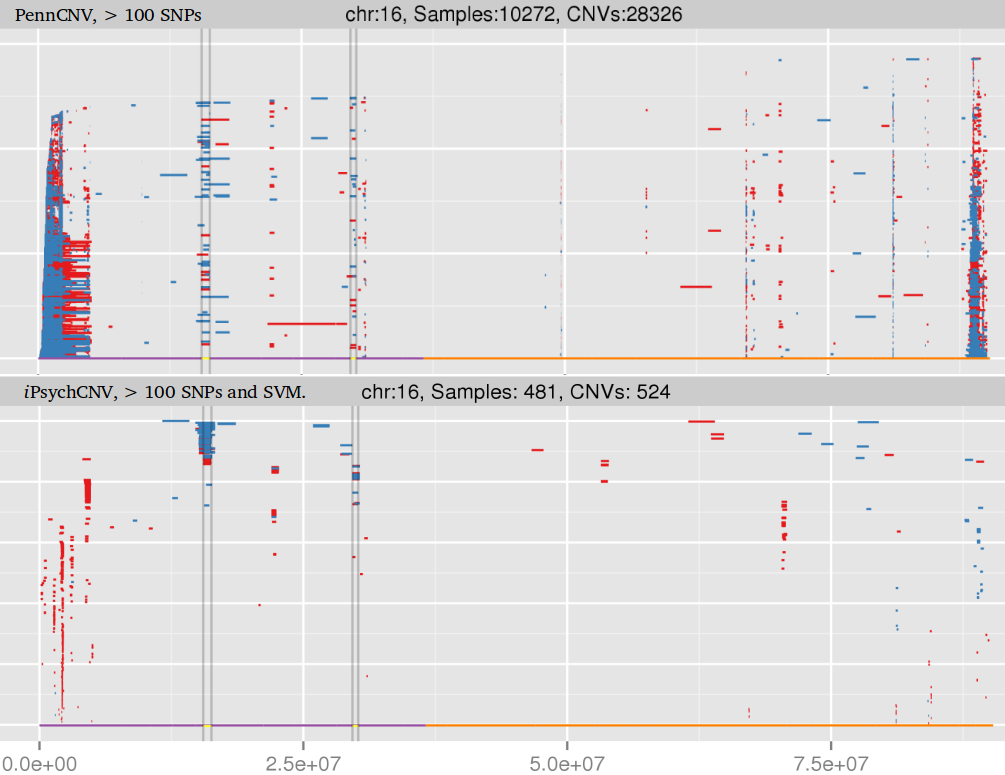
Evaluation of CNV prediction performance is an important step for methods comparison. Here we describe how binary classification is used to evaluate the method performance.
iPsychCNV uses many different methods to perform a series of functions. Here we describe in detail the methods used by iPsychCNV.

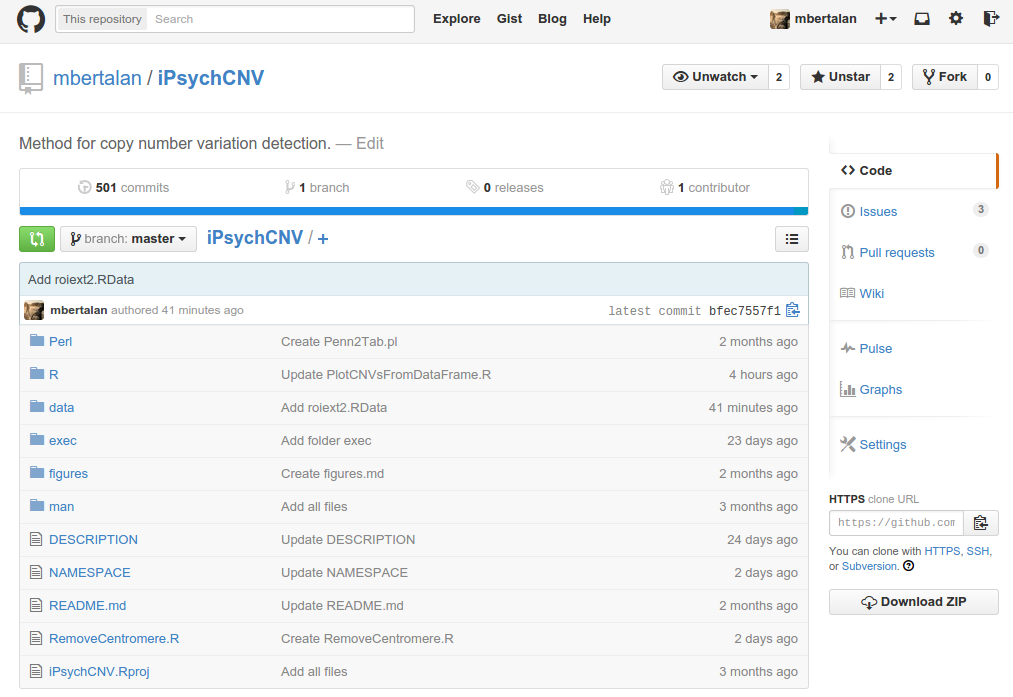
iPsychCNV is an open source R package project. People are welcome to give suggestions, code new functions and/or improve existing ones. The source code is available at Github .

iPsychCNV is a method to find copy number variation from amplified DNA from dried blood spots on Illumina SNP array. It is designed to handle large variation on Log R ratio, and uses B allele frequency to improve CNV calls. iPsychCNV is an open source project on Github

The project will study five specific mental disorders; autism, ADHD, schizophrenia, bipolar disorder and depression. All disorders are associated with major human and societal costs all over the world. The iPSYCH project will study these disorders from many different angles, ranging from genes and cells to population studies, from fetus to adult, from cause to symptoms of the disorder, and this knowledge will be combined in new ways across scientific fields, visit iPSYCH.